AZURE DEVOPS DASHBOARD WIDGETS

Chunk Dashboards

See pipeline health where your team checks progress.

Add focused pipeline cards to your Azure DevOps dashboard. Choose the pipeline, metric and time window independently for every card.

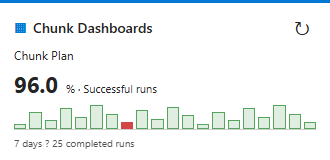
Chunk Dashboards pipeline card showing 96 percent successful runs over seven days and run-duration history
A pipeline health card with illustrative data. History bars show run durations.

PUT IT TO WORK

Three ways to use Chunk Dashboards

Illustrative examples to help you choose the right workflow for your team.

01

Watch pipeline reliability

Example: check the last seven days of your release pipeline.

Release pipeline · 7 days96.0%

Successful runs

24 succeeded / 25 completed

Choose Successful runs and 7 days. Only Succeeded results count as successes; failed, canceled and partially successful completed runs remain in the denominator.

02

Track build activity

Example: see how often your main pipeline completes.

Main pipeline · 24 hours12runs

Completed runs

All completed outcomes included

Choose Completed runs and 24 hours. Queued and running builds are excluded. Add another card with a longer window to compare activity over time.

03

Understand time spent running

Example: total the duration of recent pipeline runs.

Validation pipeline · 7 days150.0min

Total pipeline run time

10 runs averaging 15 minutes in this example

Choose Total pipeline run time and 7 days. The headline sums run durations; it is not an average. The history bars show the latest 20 run durations, regardless of the headline metric.

GET STARTED

Set up in Azure DevOps

Periods are rolling windows of 24 hours, 7 days or 30 days. The card reads completed runs using your Azure DevOps access. It does not start or change builds. Chunk Suite is not required.

Read the complete guide →
  1. Install the extension edition available to your Azure DevOps organization. Private Testing editions must be shared with your organization.
  2. Open Overview > Dashboards, choose a dashboard, then Edit > Add a widget.
  3. Find Chunk Dashboards and add its pipeline health card.
  4. Configure an accessible pipeline, metric and period, then save the widget and finish editing the dashboard.

← Explore all Additional Tools